How to Read NSE/BSE Order Books: Depth, Best 5, and Liquidity Signals
When you look at the order book on NSE or BSE, it’s not just a list of prices and quantities. It’s a live snapshot of what buyers and sellers are actually doing right now. Most retail traders ignore it, but the ones who master it see moves before they happen. If you’re trading Indian equities, learning to read the order book isn’t optional-it’s the difference between guessing and knowing.
What Is the Order Book?
The order book is a real-time list of all buy and sell orders for a stock, sorted by price. On NSE and BSE, it shows the best 5 levels on each side: five bid prices (what buyers are willing to pay) and five ask prices (what sellers are asking). Each level also shows the total number of shares available at that price. This isn’t just data-it’s market psychology in motion.
For example, if you see 50,000 shares sitting at ₹1,200 bid, that’s not random. Someone-likely a institutional trader or a hedge fund-is stacking orders there. Why? Because they believe the price won’t drop below that. If those orders vanish suddenly, it’s a red flag.
Understanding Market Depth
Market depth is the total volume available at each price level. It tells you how much pressure there is at key prices. A shallow order book with only 1,000 shares at each level means the stock can be moved easily-big trades will spike the price. A deep book with 500,000+ shares at the top levels means the stock has strong liquidity.
Here’s how to check depth quickly:
- Look at the total bid volume (sum of all buy orders in the best 5 levels)
- Compare it to the total ask volume (sum of all sell orders)
- If bids are 2x or more than asks, buyers are in control
- If asks are 3x larger, sellers are overwhelming buyers
For instance, in Reliance Industries, you might see bids totaling 2.1 million shares and asks at 400,000. That imbalance tells you institutional buyers are accumulating. Don’t just take the top bid-look at the whole stack. If the second and third bid levels are thin, the big bid at the top might be a trap.
The Best 5 Levels: More Than Just Prices
The top five bid and ask prices are the most watched. But most traders only look at the very top. That’s a mistake. The real insight is in the shape of the ladder.
Here are three patterns you need to recognize:
- Steep Climb - Bid prices drop sharply from ₹1,200 to ₹1,195 with 50,000 shares at each level. This shows strong conviction. Buyers are willing to pay up, and sellers are holding back.
- Flat Wall - 300,000 shares at ₹1,200, then 10,000 at ₹1,199. This is a liquidity trap. Someone placed a massive order at the top, but there’s no real depth below. It’s often a spoof order meant to scare sellers.
- Gradual Decline - Each level down has 10-20% less volume. This is healthy. It means orders are natural, not manipulated.
Same goes for the ask side. If asks are stacked thick at ₹1,205 but drop off fast after that, sellers are confident the price won’t rise. If the ask side is thin, the stock is vulnerable to a quick upward move.

Liquidity Signals: Where the Money Is
Liquidity isn’t about trading volume-it’s about how easily you can buy or sell without moving the price. High liquidity means large orders can be filled without causing spikes. Low liquidity means even small trades shake things up.
Here’s how to spot liquidity signals:
- Order size clustering - If you see 50,000 shares at ₹1,200, then 50,000 at ₹1,199, that’s likely one big player splitting their order. They don’t want to reveal their hand.
- Hidden orders - On NSE, you can’t see iceberg orders (large orders broken into small chunks). But if you notice the top bid keeps getting replaced with the same size right after it’s eaten, that’s a sign hidden liquidity is still there.
- Volume spikes with no price change - If 200,000 shares trade in 10 seconds but the price stays flat, liquidity is deep. Big players are absorbing the flow.
Stocks like HDFC Bank, Infosys, and TCS usually have deep order books. Small-cap stocks? Often, the top bid has 5,000 shares and the next level has 500. That’s a liquidity minefield.
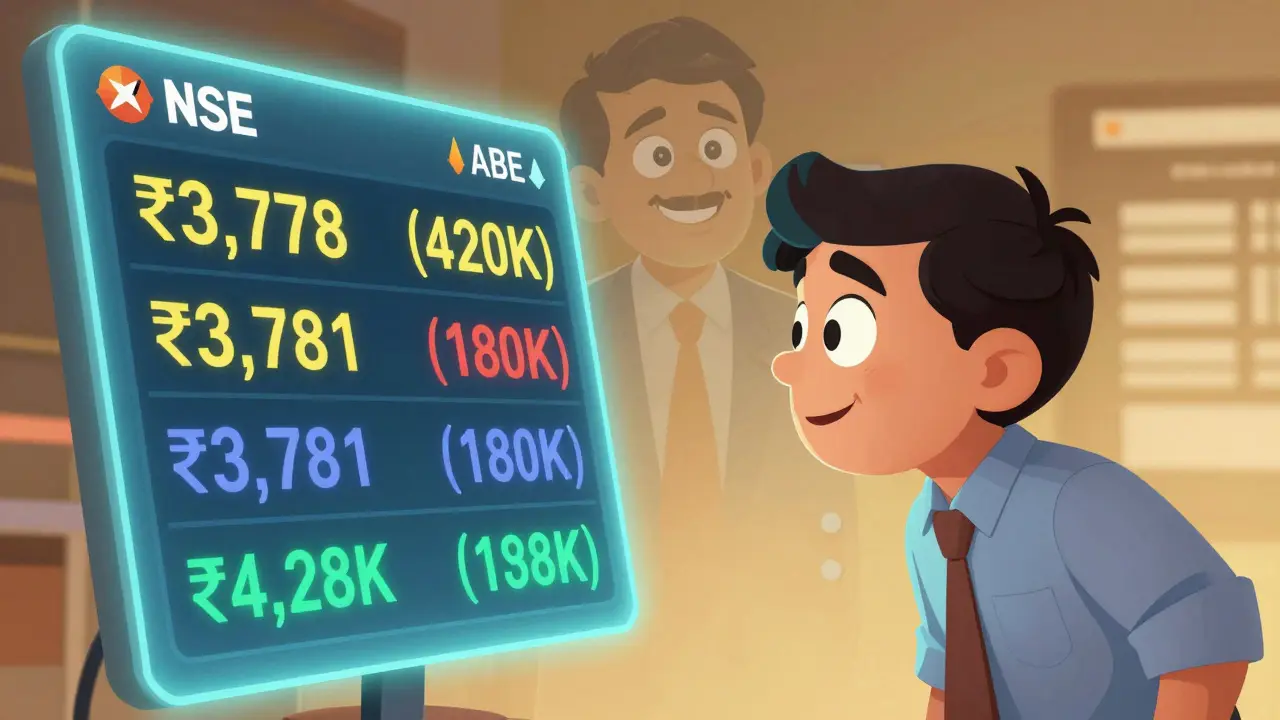
Real-World Example: TCS on March 5, 2026
On March 5, TCS opened at ₹3,780. The order book showed:
- Bids: ₹3,778 (420,000 shares), ₹3,777 (110,000), ₹3,776 (85,000)
- Asks: ₹3,781 (180,000), ₹3,782 (45,000), ₹3,783 (12,000)
Bid volume was more than double the ask volume. The top bid had a huge stack-clearly institutional. The ask side was thin, especially above ₹3,782. Within 15 minutes, the price rose to ₹3,788. Why? Buyers kept eating the shallow asks, and sellers had no depth to hold the price down. The order book told you this was coming.
What to Avoid
Many traders fall for these traps:
- Chasing the top bid - Just because the top bid is ₹1,200 doesn’t mean you’ll get filled there. The market might be moving fast. Use limit orders.
- Ignoring the ask side - If the ask volume is 10x the bid, the stock is likely to drop. Don’t assume buyers will step in.
- Thinking volume = strength - A stock can have high trading volume but low order book depth. That means it’s being pumped by retail traders, not institutions.
Also, don’t rely on the order book alone. Combine it with price action. If the order book looks strong but the candlesticks are forming bearish engulfing patterns, trust the price. The order book shows intent; price shows action.
Tools You Need
To read the order book properly, you need a platform that shows real-time depth. Zerodha Kite, Upstox, and Groww all display the best 5 levels. But make sure you’re on the depth chart view, not just the price chart. Some brokers hide the full book unless you pay for premium data.
Set alerts for large changes in bid/ask volume. If the top bid drops from 300,000 to 50,000 in under a minute, that’s a signal. It doesn’t mean the stock will crash-it means someone’s pulling back. Maybe they were testing the waters.
Final Rule: Depth Changes Before Price
The order book moves before the price does. Always. That’s why professional traders watch it like a hawk. If you see the bid volume shrinking while price is flat, get ready for a drop. If ask volume vanishes and bids start climbing, get ready to buy.
It’s not magic. It’s pattern recognition. And once you start seeing the order book as a living thing-where each order is a decision, each level a battle line-you’ll stop guessing and start anticipating.
Can I see the full order book on NSE or BSE?
No. Retail traders only see the best 5 bid and ask levels. The full order book-called the depth of market-is only available to institutional traders and market makers. But the best 5 levels are enough for retail traders to spot trends and liquidity imbalances.
Why do bid and ask sizes change so fast?
Orders are constantly being added, canceled, or filled. Large traders often place and cancel orders to test reactions-this is called spoofing. A sudden drop in bid size might mean a big buyer is pulling back, not that the stock is weak. Watch the pattern over 30-60 seconds, not one second.
Is a large bid at the top always a good sign?
Not always. A single large bid with thin levels below it is often a spoof order. Real institutional buyers spread their orders across multiple levels. If the top bid is huge but the next three levels are nearly empty, it’s likely a trap to lure sellers into selling too soon.
How do I know if liquidity is real or fake?
Real liquidity shows consistent depth across multiple levels. Fake liquidity has one huge order at the top and almost nothing underneath. Also, if the same large order keeps reappearing right after it’s filled, it’s likely hidden. Check volume over time-if price moves with high volume but the order book stays stable, liquidity is real.
Should I trade based only on the order book?
No. The order book tells you intent, but price tells you action. Always combine it with candlestick patterns, volume trends, and key support/resistance levels. For example, if the order book looks bullish but the stock is trading below its 20-day moving average, wait for confirmation before buying.