How to Read Stock Charts: Technical Analysis Basics for Indian Investors
Most Indian retail investors start trading with hope, not strategy. They buy stocks because a friend recommended them, or because the price went up last week. But without knowing how to read stock charts, they’re flying blind. The good news? Learning technical analysis isn’t about complex math or insider secrets. It’s about spotting patterns that repeat - and understanding what they mean for your next move.
What You’re Actually Looking At
A stock chart is a timeline of price action. Every dot, line, or candle tells you what buyers and sellers did at a specific moment. On Indian exchanges like NSE and BSE, you’ll mostly see three types: line charts, bar charts, and candlestick charts. Candlesticks are the most popular because they show more detail in one look.
Each candle has four key parts: open, close, high, and low. The thick part (the body) shows the difference between the opening and closing price. If the body is green or white, the stock closed higher than it opened. If it’s red or black, it closed lower. The thin lines above and below the body are wicks - they show the highest and lowest prices reached during that time period.
For example, if you’re looking at a daily chart of Reliance Industries, and you see a long red candle with tiny wicks, that means sellers pushed the price down hard and held it there. No real rebound. That’s a strong signal.
Support and Resistance: The Invisible Walls
Every stock has price levels where it keeps bouncing back - or breaking through. These are support and resistance. Support is where buyers step in and stop the price from falling further. Resistance is where sellers step in and stop it from rising.
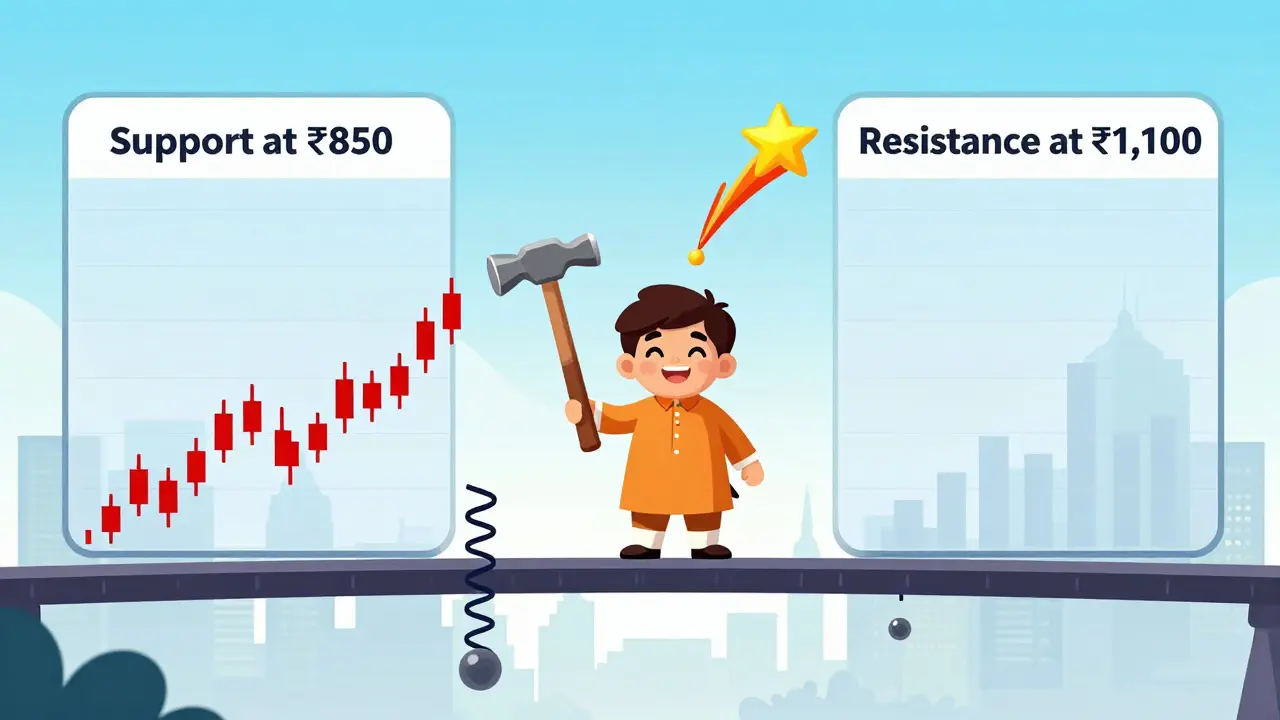
Look at Tata Motors’ chart over the last six months. If the price kept bouncing off ₹850, that’s support. If it kept failing to break past ₹1,100, that’s resistance. These aren’t magic numbers - they’re areas where lots of traders have placed orders in the past.
When a stock breaks through resistance, it often becomes new support. And when it falls below support, that level often turns into resistance. This flip is one of the most reliable patterns in technical analysis. Indian investors often miss this - they focus only on the current price, not the history behind it.
Candlestick Patterns That Actually Matter
You don’t need to memorize 50 patterns. Just learn the top five that show up often on Indian stocks.
- Doji: The open and close are almost the same. The body is tiny. This means indecision - buyers and sellers are tied up. After a big up move, a Doji can mean the rally is losing steam.
- Hammer: A small body at the top of a long lower wick. It shows the price dropped hard but buyers came in and pushed it back up. Common after a downtrend. Seen often in mid-cap stocks like Bajaj Finance during market corrections.
- Shooting Star: Opposite of the hammer. Small body at the bottom, long upper wick. Happens after an uptrend. Sellers pushed the price up, then dumped it. A warning sign.
- Engulfing Pattern: A big candle completely covers the previous one. A bullish engulfing (green after red) means buyers took control. A bearish engulfing (red after green) means sellers did.
- Three White Soldiers: Three long green candles in a row, each closing higher than the last. Rare but powerful. Seen in stocks like HDFC Bank after strong earnings announcements.
Don’t trade on a single candle. Wait for confirmation. If you see a hammer on Monday, wait until Tuesday’s candle closes above it. That’s your signal to act.
Volume: The Hidden Confirmation
Price tells you what happened. Volume tells you how many people cared.
A breakout on low volume? Probably fake. A breakout on high volume? That’s real money moving in. For example, when Zomato went public in July 2021, its first big up day had volume 7x higher than average. That wasn’t noise - it was institutional interest.
On TradingView or Zerodha Kite, you’ll see volume bars below the chart. Watch for spikes. If a stock jumps 5% but volume stays flat, it’s likely a short squeeze or a bot-driven move - not sustainable. If volume surges with the move, you’re seeing real conviction.
Trendlines: Drawing the Path
Markets don’t move in straight lines, but they do have direction. A trendline connects at least two swing lows (for uptrends) or two swing highs (for downtrends). It’s not about drawing a perfect line - it’s about seeing the general flow.
Take Infosys. Between January and August 2024, its price made higher lows. Connect those lows with a line. As long as the price stayed above that line, the trend was up. When it broke below - that’s your exit signal.
Don’t force trendlines. If you have to stretch the line to make it fit, it’s not valid. Real trends have clean, repeatable touches. Indian traders often draw too many lines and get confused. Less is more.
Timeframes: What You’re Really Trading
Are you trading for the day? The week? The month? Your chart timeframe should match your goal.
- 5-minute or 15-minute charts: For intraday traders. Too noisy for beginners.
- Daily charts: Best for swing traders holding 2-10 days. Most Indian retail investors should start here.
- Weekly charts: For investors holding months or years. Shows the big picture. Used by fund managers at ICICI Prudential or SBI Mutual Fund.
Here’s the trick: always check the weekly chart first. If the long-term trend is down, don’t buy just because the daily chart looks bullish. You’re fighting the tide. Most losses come from trading against the higher timeframe trend.
Common Mistakes Indian Investors Make
You’ll see people online saying, “I bought because the RSI was oversold.” Or “I sold because the MACD crossed.” But they don’t know what those indicators mean in context.
- Overcomplicating: Using 10 indicators at once. You only need price, volume, and one or two tools. More tools = more noise.
- Ignoring context: A bullish candle on a downtrend isn’t a buy signal - it’s a trap.
- Chasing pumps: Stocks like Adani or smaller mid-caps spike on rumors. If you buy after the 20% jump, you’re buying the hype, not the chart.
- Not using stop-losses: Technical analysis isn’t about predicting the future. It’s about managing risk. Set a stop-loss at the last support level. If the chart breaks it, you’re out. No emotion.

Where to Practice
You don’t need money to learn. Use free tools:
- Zerodha Kite: Free charts, real-time data, and volume indicators.
- TradingView: Free plan lets you draw trendlines, add candlestick patterns, and compare stocks.
- NSE India website: Download historical data for any stock and study past moves.
Start with one stock. Pick a big, liquid one like HUL, SBI, or TCS. Study its chart every day for a week. Look for support/resistance levels. Spot candlestick patterns. See how volume reacted. Write down what you see. After a month, you’ll start seeing what others miss.
Final Thought
Technical analysis isn’t a crystal ball. It’s a map. It doesn’t tell you what will happen - it tells you what’s likely based on what happened before. The best traders aren’t the ones who predict the market. They’re the ones who react to it.
Indian markets are unique. Retail investors dominate. News, festivals, monsoons, and policy changes move stocks faster than earnings. But the charts still work. Because human behavior doesn’t change. Fear and greed are universal.
Start small. Watch one chart. Learn one pattern. Add one rule. In six months, you’ll be ahead of 90% of the people trading in India today.
Do I need to learn fundamental analysis to read stock charts?
No. Technical analysis works on price and volume alone. You can trade successfully without looking at earnings, debt, or P/E ratios. But combining both gives you a stronger edge. For example, if a stock breaks resistance on high volume and also reports strong quarterly results, the move is more likely to continue. But you don’t need fundamentals to start reading charts.
Can I use technical analysis for mutual funds?
Not really. Mutual funds don’t trade intraday, and their price is set once a day at NAV. You can’t use candlesticks or intraday patterns on them. But you can track their trend over weeks or months. If a fund has been rising steadily for 6 months, that’s useful. But don’t try to time daily moves - it doesn’t work.
Which timeframe is best for beginners in India?
Start with daily charts. They filter out the noise of minute-by-minute moves and show real trends. You’ll see support and resistance clearly. You’ll spot candlestick patterns without being overwhelmed. Once you’re comfortable, you can check 1-hour charts for entry timing - but daily is your foundation.
Is technical analysis reliable in Indian markets?
Yes - but with a caveat. Indian markets are more emotional than U.S. or European ones. Retail traders react fast to news, rumors, or social media. That creates more volatility - and more patterns. The same candlestick signals work here, but they happen more often. The key is patience: wait for confirmation. Don’t jump on the first signal.
How long does it take to get good at reading charts?
You’ll understand the basics in 2-3 weeks if you study one chart daily. You’ll start making consistent trades in 3-6 months. Mastery takes years - but you don’t need mastery to make money. You just need discipline, a simple system, and the ability to follow your rules.
Next Steps
Here’s what to do next:
- Pick one Indian stock you’re interested in - like Reliance, ICICI Bank, or Titan.
- Open its daily chart on Zerodha Kite or TradingView.
- Draw one support and one resistance level.
- Find one candlestick pattern from the last 10 days.
- Write down what happened after that pattern - did the price go up or down?
Do this once a week for a month. You’ll start seeing the rhythm of the market. That’s when trading stops being gambling - and starts being strategy.